
Nivash Ramaiah
Lead Data Analyst | Food, IT and Healthcare
About Me
I'm a Data Analyst with 3+ years of experience. I have written 1,000+ SQL queries in Metabase BI at Curefoods, a food-tech startup in India with a USD 375 million valuation. I joined the company during its early stages and provided analytical solutions for CXOs, functional teams, and store managers.I have expertise in Python for automation and analytical tools such as Menu Intelligence, customer review analysis, and forecasting.I have also worked with other data tools such as Hevo ETL, Power BI, Google BigQuery, MongoDB (NoSQL), and R.
Skills
Power BI | Metabase BI | SQL | Python | R Studio | Hevo ETL
SQL and reporting - 3+ years
Python Automation - 3+ years
Project Management - 2+ years
Data Engineering - 1+ years
Projects
CLICKHOUSE | Metabase BI | SQL
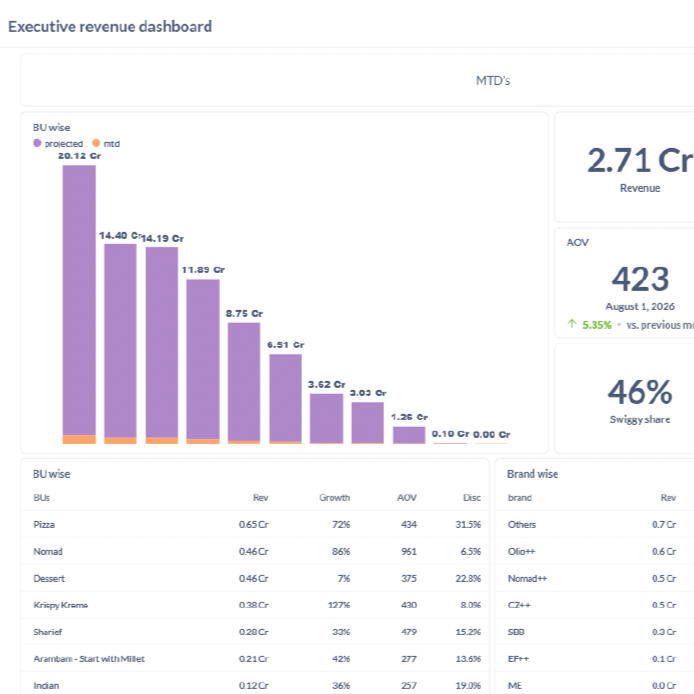
Executive Revenue Dashboard
Unified different brands data into a single repository in Clickhouse and created an interactive revenue dashboard that informs CXOs of revenue updates.
PYTHON | CHAT GPT API
Customer Review Analysis
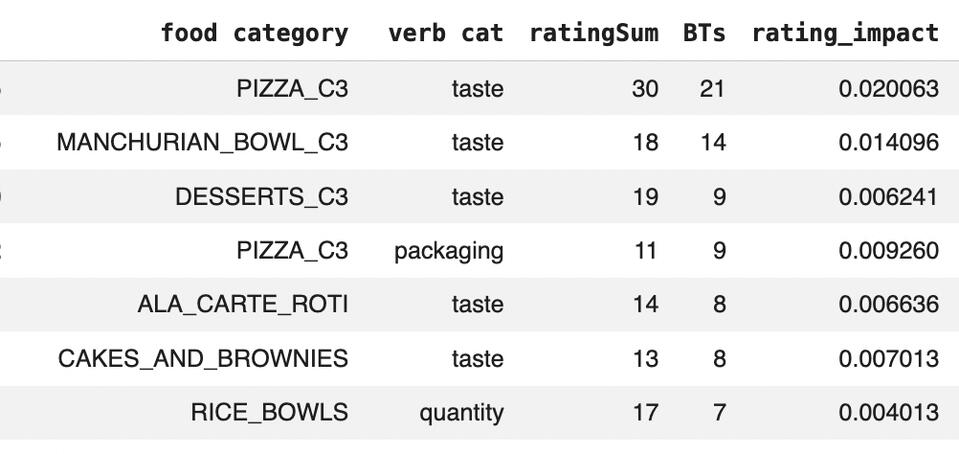
Used CHAT GPT API model to read and perform sentiment analysis on the customer verbatim, to identify key operations pain points that were seen at regional level.
Executive Revenue Dashboard

Business Problem
CXOs had to navigate multiple reporting platforms—including Metabase dashboards, Python-generated reports, and Excel files—to track the performance of 10+ brands, leading to inefficiencies and an increased risk of reporting errors.
Business Question
How can we provide CXOs with a centralized, accurate, and real-time view of business performance across all brands to support strategic decision-making?
Approach
Process 1: Business RequirementsSpoke with different business vertical heads to understand their reporting needs and noted down the key data requirements for the executive dashboard.Process 2: Data ModellingUsing techniques such as Snowflake schema modelling, designed and modelled nearly 10 tables to organize the data required for the reporting.Process 3: Data ValidationAfter the data provider team configured the endpoint connections and the data started flowing, validated the data integrity and accuracy by cross-checking it against the ground truth.Process 4: Metabase BI IntegrationConfigured the database with Metabase BI and set up the required data governance, including access and reporting controls.Process 5: DashboardingUsed SQL in Metabase BI to build an executive revenue dashboard covering all our brands, with multiple views and charts to give CXOs a centralized view of business performance.
CUSTOMER REview ANALYSIS
Business Problem
Regional store managers lacked the insights needed to identify and prioritize the top issues customers faced when ordering food from their stores.
Business Question
Which customer pain points have the greatest impact on the ordering experience, and which should managers address first at each store?
Approach
1. Preprocessed the customer verbatims dataset by cleaning the data and adding information about the region and food category.2. Experimented with different ChatGPT models and prompts to check their accuracy in identifying customer sentiment and issues. Based on the results, selected the GPT-3.5 Turbo model and the best-performing prompt for the analysis.3. Developed a Python script using the ChatGPT API to process two weeks’ worth of customer verbatims at a time (approximately 10,000 verbatims per batch), identifying the issue mentioned and the sentiment of each response.4. Filtered the negatively rated verbatims and used Pandas to calculate the frequency of each issue × food category combination, helping identify the most common customer problems.5. Shared the most frequent issue × food category combinations with the respective store-level managers so they could prioritize the most common customer issues.
Impact
1. After implementing the insight-sharing process, the data team and operational zonal leads connected fortnightly to discuss the actions taken based on the insights and track their impact.2. Within two months of implementation, storefront ratings on our delivery apps improved by 0.3 points across approximately 200 stores and by 0.2 points across approximately 100 stores.